Represent cartesian x/y data within a radial plot.
Features
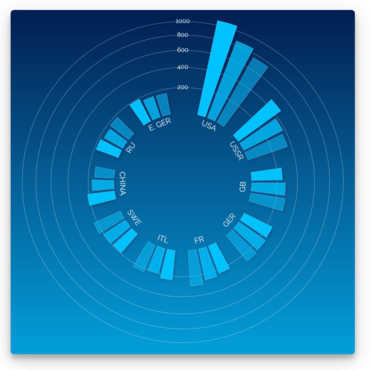
Vizuly Radial Bar is designed to represent cartesian x/y data within a radial plot. It supports both clustered and stacked radial bars Use the interactive style explorer on the left to view different style settings, themes, and other customizable properties.
Features
- Supports clustered and stacked layouts
- 6 example themes
- More than a dozen dynamic styles
- Dozens of adjustable properties and interactive event support
- Customizable Data Tips
- Documentation
Framework Adapters
- React Adapters
- Angular Adapters
- Vue.js Adapters